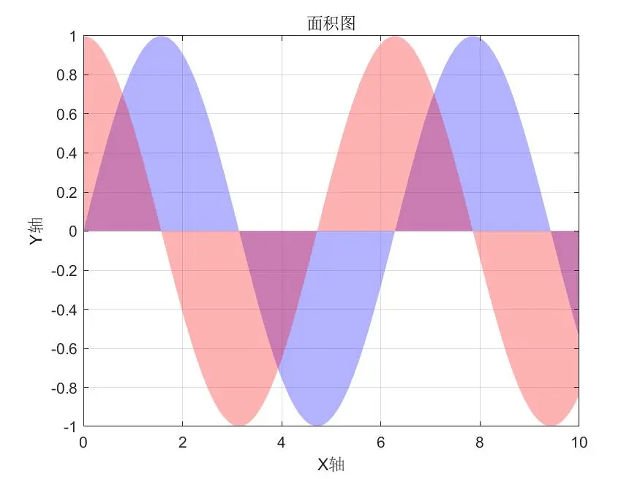
MATLAB源代碼如下:
x = linspace(0, 10, 100);y1 = sin(x);y2 = cos(x);
figure;fill_between(x, y1, 'FaceColor', 'blue', 'FaceAlpha', 0.4);hold on;fill_between(x, y2, 'FaceColor', 'orange', 'FaceAlpha', 0.4);title('面積圖');xlabel('X軸');ylabel('Y軸');grid on;saveas(gcf, '面積圖.jpg');
效果圖如下:

